on
Markdown Visualization Made Easy with Mermaid.js
In the world of web development, sharing complex information through diagrams and flowcharts is essential. These visuals not only help people understand better but also make technical documents look more professional. I had the chance to use a great JavaScript library called Mermaid.js while working with the AsyncAPI Initiative.
In this blog post, I’ll share my experience with Mermaid.js and how it charted the course for better communication and visualization throughout my project.
What is Mermaid.js?
Mermaid.js is an open-source JavaScript library that makes creating diagrams easy for anyone working with Markdown. Whether you’re writing technical docs, blog posts, or need to show data visually, Mermaid.js lets you create diagrams using a simple and easy-to-understand syntax that fits well with Markdown.
Mermaid Syntax
The beauty of Mermaid.js lies in its human-readable syntax, allowing even non-developers to create diagrams effortlessly. By using a combination of code blocks and predefined keywords, you can describe various types of diagrams, including flowcharts, sequence diagrams, Gantt charts, class diagrams, and more.
graph TD
    A[Start] --> B[Process 1]
    B --> C[Process 2]
    C --> D[Process 3]
    D --> E[End]
Installation and Usage
Getting started with Mermaid.js is a breeze. You can include it in your project using package managers like npm or yarn, or directly use a CDN. Once integrated, you can start writing Mermaid diagrams within your Markdown files, ready to be rendered on your website or documentation platform.
Supported Diagram Types
Mermaid.js supports an impressive range of diagram types, each tailored to specific use cases:
-
Flowcharts: Visualize processes, decision trees, and workflows with clear and concise flowcharts, enhancing communication and understanding.
-
Sequence Diagrams: Illustrate the interaction between different entities and the order of events, making it ideal for visualizing system behaviors and communication flows.
-
Gantt Charts: Plan and manage project schedules effectively by creating Gantt charts with tasks, milestones, and dependencies.
-
Class Diagrams: Model object-oriented systems and their relationships, making it easier to design and document software architectures.
Examples and Visuals
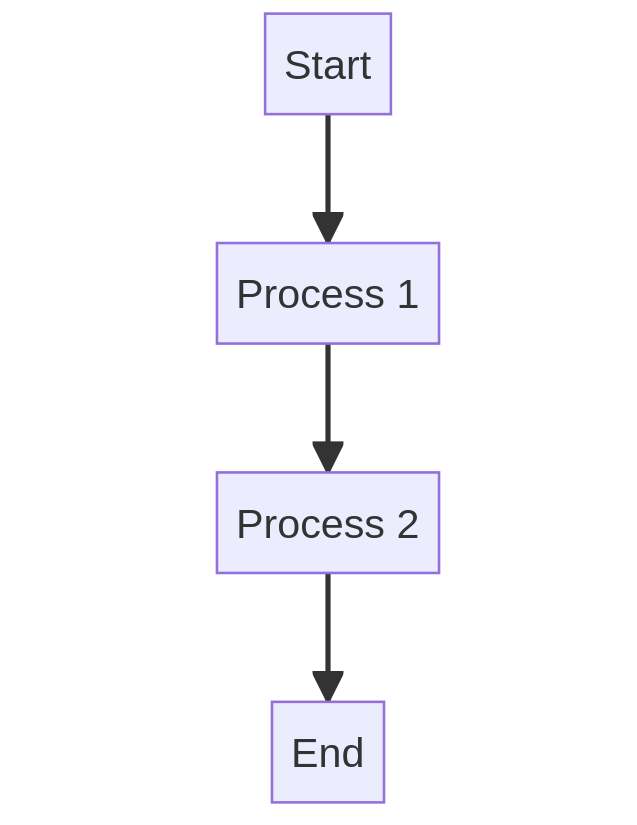
Example 1: Flowchart
graph TD
    A[Start] --> B[Process 1]
    B --> C[Process 2]
    C --> D[Process 3]
    D --> E[End]
Visual representation of the flowchart
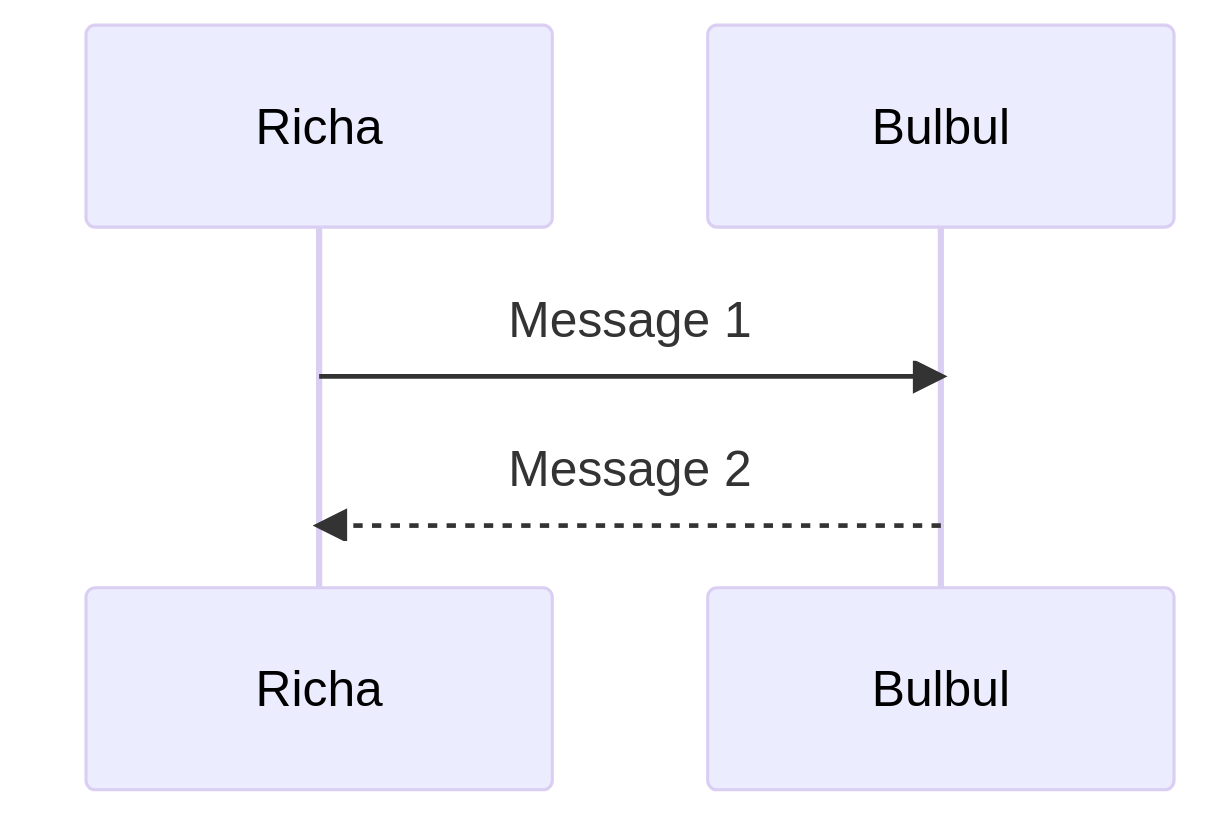
Example 2: Sequence Diagram
sequenceDiagram
    participant Richa
    participant Bulbul
    Richa->>Bulbul: Message 1
    Bulbul-->>Richa: Message 2
Visual representation of the sequence diagram
Example 3: Gantt Chart
gantt
    title Project Schedule
    dateFormat  YYYY-MM-DD
    section Planning
    Task 1: 2023-08-01, 3d
    section Development
    Task 2: 2023-08-04, 5d
Visual representation of the Gantt chart

Advantages of Using Mermaid.js
-
Simplicity: Mermaid’s intuitive syntax makes it easy for both developers and non-developers to create diagrams without a steep learning curve.
-
Integration: Being a JavaScript library,
Mermaid.jsintegrates seamlessly with Markdown editors, documentation platforms, and version control systems. -
Dynamic Diagrams:
Mermaid.jsallows you to create interactive and animated diagrams, enhancing user experience and engagement.
Real-world Example: Explaining a Project Using Mermaid.js
Currently, I’m working with the AsyncAPI Initiative. When we kicked off the project, my mentor and I set aside specific time to work with Mermaid.js. Together, we crafted multiple flowcharts that illustrated the different parts of the project and how they fit together. These charts became a handy tool to help us explain the project’s ins and outs in a simpler way, right from the beginning.
And now, if you’re curious, you can take a look at how I applied Mermaid.js to explain the entire project solution using this link.
Conclusion
Mermaid.js is a powerful and user-friendly JavaScript library that simplifies the process of creating diagrams. By using Mermaid.js, you can easily convey intricate concepts, improve your documentation, and enhance the visual quality of your content. Whether you’re a developer, technical writer, or blogger, give Mermaid.js a shot and witness how it turns your diagrams into captivating visuals.