on
Streaming Data Science with Streamlit
I recently used Streamlit to showcase data for my package, Elexonpy, which is published on PyPI. As I worked on the package, it became clear that presenting the data in an engaging and interactive manner was important for users to fully understand and leverage its features. With numerous data visualization tools available, finding one that was both easy to use and capable of delivering a polished user experience was essential.
In this blog post, I’ll walk you through how Streamlit helped me build an effective data presentation for my package, share some practical tips for getting started, and explore the features that make Streamlit a standout tool for data visualization and web app development.
Why Choose Streamlit?
Streamlit is a Python library designed to simplify the creation of web applications for data science. Here’s why it stood out for my project:
-
Simplicity and Speed: Streamlit’s syntax is straightforward, allowing you to build applications with minimal code.
-
Customizable Widgets: The library offers a range of built-in widgets such as sliders, buttons, and file uploaders, which can be customized to fit the needs of your application.
-
Integration with Data Science Libraries: Streamlit integrates effortlessly with popular libraries like Pandas, Matplotlib, and Plotly. This compatibility made it easy to incorporate various data visualization techniques and charts into the app.
-
Real-Time Interactivity: The framework supports real-time updates, meaning that any changes in the input or data are instantly reflected in the app. This feature enhances the user experience by allowing users to interact with the data seamlessly.
Building the Elexonoy Dashboard with Streamlit
To get started with Streamlit, I followed the below steps:
Step 1: Installation
First, I installed Streamlit using pip:
pip install streamlit
Step 2: Creating the App
I created a Python script (elexon_solar-forecast.py) and added the following code to build an interactive dashboard:
import streamlit as st
import pandas as pd
from datetime import datetime, timedelta
from elexonpy.api_client import ApiClient
from elexonpy.api.generation_forecast_api import GenerationForecastApi
import plotly.graph_objects as go

# Function to fetch and process data
def fetch_forecast_data(api_func, start_date, end_date, process_type):
    try:
        response = api_func(
            _from=start_date.isoformat(),
            to=end_date.isoformat(),
            process_type=process_type,
            format="json",
        )
        if not response.data:
            return pd.DataFrame()

        df = pd.DataFrame([item.to_dict() for item in response.data])
        solar_df = df[df["business_type"] == "Solar generation"]
        solar_df["start_time"] = pd.to_datetime(solar_df["start_time"])
        solar_df = solar_df.set_index("start_time")

        # Only resample if there's data
        if not solar_df.empty:
            solar_df = solar_df.resample("30T")["quantity"].sum().reset_index()

        return solar_df
    except Exception as e:
        st.error(f"Error fetching data for process type '{process_type}': {e}")
        return pd.DataFrame()

# Initialize Elexon API client
api_client = ApiClient()
forecast_api = GenerationForecastApi(api_client)
forecast_generation_wind_and_solar_day_ahead_get = (
    forecast_api.forecast_generation_wind_and_solar_day_ahead_get
)

# Streamlit app
st.title("Elexon Solar Forecast")

start_datetime_utc = st.date_input("Start Date", datetime.utcnow() - timedelta(days=3))
end_datetime_utc = st.date_input("End Date", datetime.utcnow() + timedelta(days=3))

if start_datetime_utc < end_datetime_utc:
    # Fetch data for each process type
    process_types = ["Day Ahead", "Intraday Process", "Intraday Total"]
    colors = ["red", "blue", "green"]  # Colors for each process type
    forecasts = [fetch_forecast_data(forecast_generation_wind_and_solar_day_ahead_get, start_datetime_utc, end_datetime_utc, pt) for pt in process_types]

    fig = go.Figure()
    for i, (forecast, color) in enumerate(zip(forecasts, colors)):
        if forecast.empty:
            st.write(f"No data available for process type: {process_types[i]}")
            continue

        # Remove NaNs and zero values
        forecast = forecast[forecast["quantity"].notna() & (forecast["quantity"] > 0)]

        full_time_range = pd.date_range(start=start_datetime_utc, end=end_datetime_utc, freq='30T', tz=forecast["start_time"].dt.tz)
        full_time_df = pd.DataFrame(full_time_range, columns=['start_time'])

        forecast = full_time_df.merge(forecast, on='start_time', how='left')

        fig.add_trace(go.Scatter(
            x=forecast["start_time"],
            y=forecast["quantity"],
            mode='lines',
            name=process_types[i],
            line=dict(color=color),
            connectgaps=False  # Do not connect gaps in the data
        ))

    fig.update_layout(
        title="Elexon Solar Forecast",
        xaxis_title="Date and Time",
        yaxis_title="Forecast (MW)",
        xaxis=dict(
            tickformat='%Y-%m-%d %H:%M',
            tickangle=45
        ),
        legend_title="Process Type"
    )

    st.plotly_chart(fig)
Step 3: Running the App
I ran the Streamlit app using the command:
streamlit run elexon_solar-forecast.py
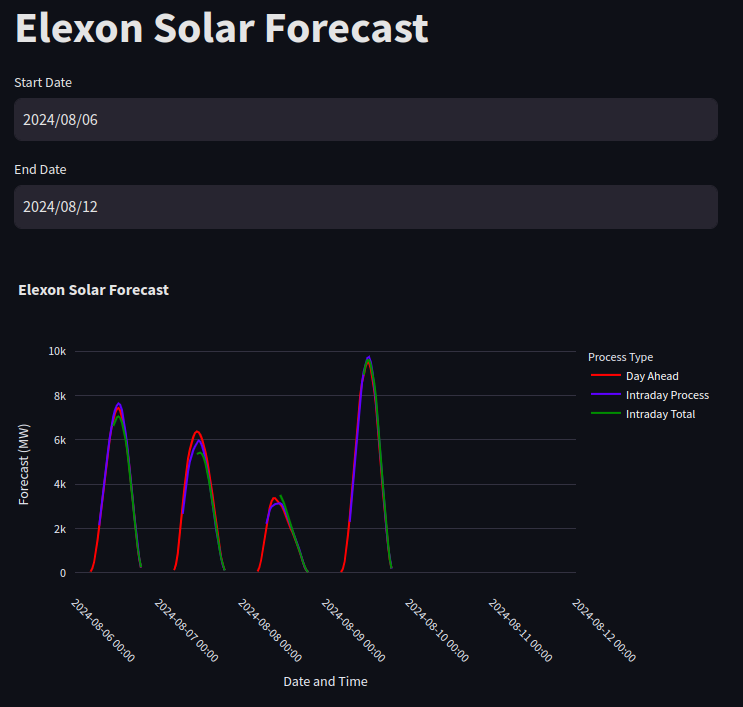
This command starts a local web server and opens the default web browser to display the interface of the Streamlit app, where we can interact with the solar forecast data.
Below is a screenshot of the app interface:
Deploying the App Publicly
One of the best features of Streamlit is the ability to deploy your app publicly with ease. Streamlit offers a service called Streamlit Community Cloud (formerly Streamlit Sharing), which allows you to deploy your app directly from a GitHub repository.
Here’s how you can deploy your Streamlit app publicly:
-
Push Code to GitHub: First, your Streamlit app should be in a GitHub repository. This should include your app.py file and any other necessary files.
-
Sign Up for Streamlit Community Cloud: Sign up for Streamlit Community Cloud at streamlit.io.
-
Deploy the App: Connect your GitHub account to Streamlit Community Cloud and choose your repository. Streamlit will automatically build and deploy the app, giving you a public URL that you can share with anyone.
Tips for Using Streamlit
Start simple by focusing on basic features first. As you get comfortable, you can add more complex features gradually. Streamlit is designed to be straightforward, so it’s easy to build up from a simple base.
Make use of Streamlit’s built-in widgets to make your app more interactive. Try out different widgets to see which ones work best for showing your data.
To keep your app running smoothly, especially with large datasets, make sure to optimize how you process and visualize data. Streamlit handles real-time updates well, but being efficient with data is important.
If you need more advanced features, you can look into adding custom components or JavaScript libraries to your Streamlit app to extend its capabilities.
Conclusion
Streamlit proved to be a tool for showcasing the data from my PyPI package, Elexonoy. Its ease of use, real-time interactivity, and seamless integration with data science libraries made it an ideal choice for creating an engaging and functional web application. The ability to deploy the app publicly with Streamlit Community Cloud further simplified sharing the application with a broader audience.
Whether you’re presenting data, building prototypes, or developing interactive dashboards, Streamlit offers a powerful solution. If you’re looking to enhance your data visualization projects or need a quick way to create interactive web apps, Streamlit is definitely worth exploring. Happy coding!