on
Jupyter Power in VS Code
I recently came across the functionalities offered by the Jupyter extension within Visual Studio Code, and I must say, it’s been a game-changer in my development toolkit. The Jupyter extension seamlessly integrates the notebook environment directly into the VS Code interface, allowing users to create, edit, and run Jupyter Notebooks effortlessly.
What are Jupyter Extensions?
Jupyter extensions are add-ons that extend the capabilities of Jupyter notebooks within VS Code. They offer a range of features, from simplifying code formatting to enabling interactive visualizations and customizing the notebook interface.
Setting Up Jupyter Notebooks in VS Code
To get started with Jupyter extensions in Visual Studio Code, it’s important to set up a Jupyter notebook file. Follow these steps:
- Navigate to the File menu and select “New File” (or use the shortcut Ctrl + N / Cmd + N).
- Save the file with the extension .ipynb (e.g., example_notebook.ipynb).
Structure of Jupyter Notebooks
Jupyter notebooks consist of cells that can contain either Markdown text or code. Here’s how to create and run cells in your notebook:
- Markdown Cells: To create a Markdown cell, select the “+” button in the toolbar and choose “Markdown.”
- Code Cells: For code cells, select the “+” button and choose “Code.” Enter your Python code in these cells.
Running Cells
- To run a Markdown cell, simply write your text and proceed to the next cell.
- To run a code cell, input your Python code and press Shift + Enter to execute it.
Now that our Jupyter notebook is ready, let’s explore the capabilities of Jupyter extensions within Visual Studio Code.
Exploring Jupyter Extensions: Examples
- Interactive Charts with matplotlib
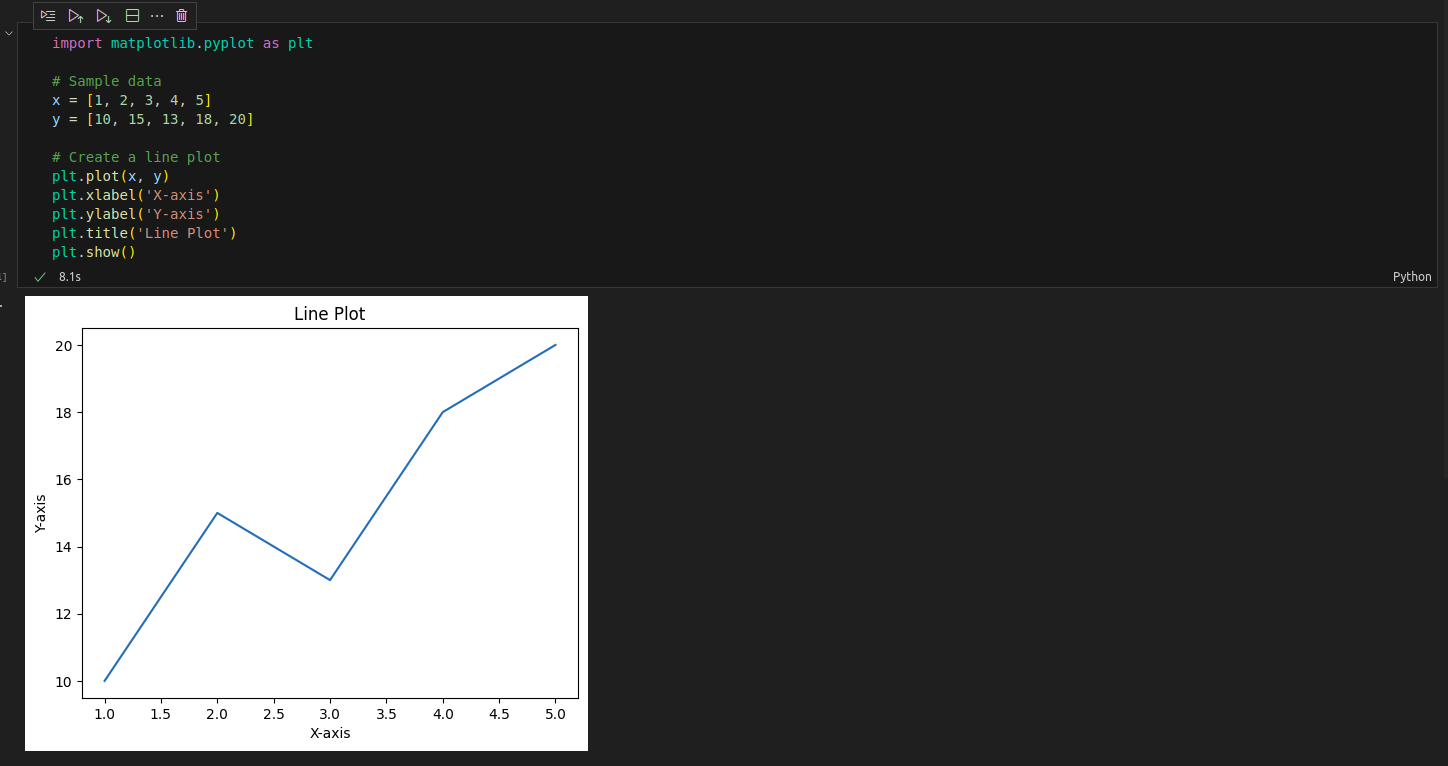
The matplotlib extension allows you to create visualizations directly within Jupyter notebooks in VS Code. Below is an example of a line plot using matplotlib:
import matplotlib.pyplot as plt

# Sample data
x = [1, 2, 3, 4, 5]
y = [10, 15, 13, 18, 20]

# Create a line plot
plt.plot(x, y)
plt.xlabel('X-axis')
plt.ylabel('Y-axis')
plt.title('Line Plot')
plt.show()
Result:

Find a comprehensive demonstration of Jupyter notebook extensions in action within the project repository: Patient-Readmission-Analysis, showcasing the practical utilization of these extensions in real healthcare data analysis.